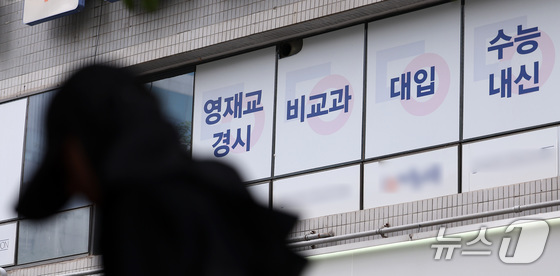
Last year, the average monthly private education expenditure per student decreased by 3.5% to 458,000 KRW (approximately 301 USD). The participation rate in private education also dropped to 75.7% from 80% the previous year.
The Gross National Income (GNI) per capita increased to 36,855 USD from 36,745 USD in the previous year. Meanwhile, the average monthly household consumption expenditure rose by 49,000 KRW (about 32 USD) to 2,939,000 KRW (about 1,931 USD) from 2,890,000 KRW (about 1,900 USD) the year before.
The Ministry of Data and Statistics released these findings on Tuesday in its report 2025 Social Indicators of Korea.
Private education costs and participation rates decline, but inequality persists
Statistics show that private education participation fell by 4.3 percentage points to 75.7% last year, marking the first decline since the COVID-19 pandemic in 2020.
Average monthly private education spending also decreased. Per-student expenditure dropped by 16,000 KRW (about 11 USD) to 458,000 KRW (about 301 USD) from 474,000 KRW (about 311 USD) the previous year.
Higher-income families spent more on private education. Households earning 3 million KRW (about 1,970 USD) monthly spent 192,000 KRW (about 126 USD), while those earning 8 million KRW (about 5,250 USD) spent 662,000 KRW (about 434 USD).
Class sizes decreased across all education levels last year. Middle schools had the highest average at 24.9 students, followed by high schools (23.4), elementary schools (19.3), and kindergartens (15.6).
The school violence victimization rate was 2.5%, highest among 4th to 6th graders (5.0%), followed by middle school (2.1%) and high school students (0.7%).
The number of multicultural students reached 202,000, accounting for 4.0% of the total student population.
Enrollment rates increased across all education levels compared to 2015. Notably, the transition rate to higher education institutions rose by 8.8 percentage points to 76.3% from 67.5% in 2015.
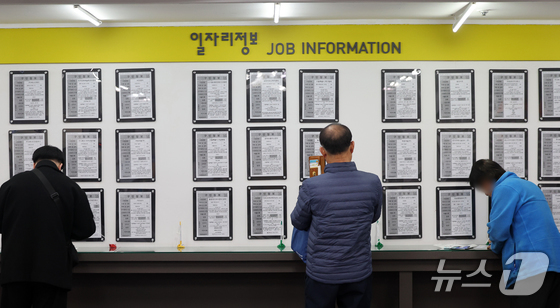
Employment Rate Hits Record High Since 1963, Driven by 30s, 40s, and 60+ Age Groups
The employment rate for ages 15-64 increased to 62.9% from 62.7%, reaching its highest level since record-keeping began in 1963.
Employment rates rose particularly for those in their 30s, 40s, and 60 and older.
The gender employment gap narrowed to 15.3 percentage points from 16.2, continuing a long-term downward trend.
The overall unemployment rate remained steady at 2.8%. However, rates for those in their 20s and 40s increased slightly to 6.1% and 2.0%, respectively.
The proportion of wage workers among the employed rose to 77.6% from 77.1%, while regular workers increased to 57.8% from 57.2%.
Per Capita GNI Up 110 USD… Average Annual Income Rises by 2.42 Million KRW, but Falls for Those in Their 30s
GNI per capita grew 0.3% to 36,855 USD. Nominal gross domestic product (GDP) reached 2,663.3 trillion KRW (1.8727 trillion USD), with real economic growth at 1.0%.
Converting GNI per capita to KRW at last year’s average exchange rate of 1,422 KRW/1 USD yields an annual income of about 52 million KRW (about 34,160 USD).
The consumer price index rose 2.1%, while the cost of living index increased 2.4%.
As of 2024, average annual household income grew by 2.42 million KRW (1,590 USD) to 74.27 million KRW (about 48,800 USD). However, households under 30 saw a decrease to 45.09 million KRW (about 29,600 USD) from 47.2 million KRW (about 31,000 USD).
The Gini coefficient for equalized disposable income was 0.325, with the income quintile ratio at 5.78. Both figures, along with the relative poverty rate, showed slight increases from the previous year.
Monthly Consumer Spending Up 49,000 KRW… Food and Lodging Top Expenses
Average monthly household consumption rose by 49,000 KRW (about 32 USD) to 2,939,000 KRW (about 1,931 USD) from 2,890,000 KRW (about 1,900 USD) the previous year.
The largest spending categories were food and accommodation (15.8%), food and non-alcoholic beverages (15.3%), housing and utilities (12.3%), and transportation (11.5%).
By age group, households headed by individuals in their 40s spent the most at 3,847,000 KRW (2,520 USD), followed by those in their 50s (3,535,000 KRW or 2,322 USD), 30s and younger (2,824,000 KRW or 1,855 USD), and 60 and older (2,212,000 KRW or 1,450 USD).
Attendance at cultural events, sports, and leisure facilities increased compared to 2023.
Cultural and sports event attendance reached 57.7% last year, up 2.4 percentage points from 2023 but still below the 66.2% recorded in 2019.
Movies were the most popular (74.9%), followed by music concerts (30.4%) and sports events (28.5%).
Leisure facility usage rose 4.4 percentage points to 73.5%. The most visited were tourist attractions (76.4%), beaches (31.6%), and forest bathing areas (29.7%).
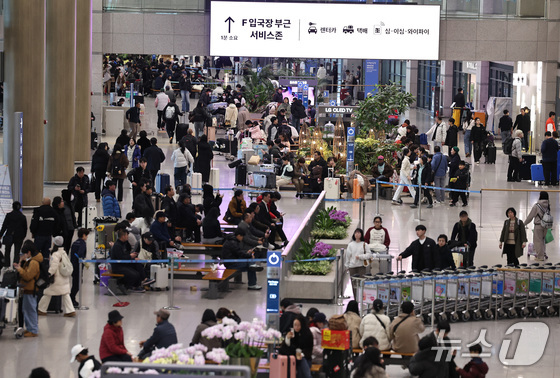
Last year, 70.2% of South Koreans aged 13 and older traveled domestically, while 31.5% went abroad.
In 2024, the average daily leisure time for those 10 and older was 4 hours and 6 minutes, with media-based activities accounting for 2 hours and 43 minutes.